- Original Article
- Published:
Effect of salinity on filtration rates of mussels Mytilus edulis with special emphasis on dwarfed mussels from the low-saline Central Baltic Sea
Helgoland Marine Research volume 67, pages 591–598 (2013)
Abstract
The effect of salinity on the filtration rate of blue mussels, Mytilus edulis, from the brackish Great Belt (Denmark) and the low-saline Central Baltic Sea, respectively, was studied. First, we measured the effect of long-term (weeks) constant ambient salinities between 5 and 30 psu on the filtration rate of M. edulis collected in the Great Belt where the mean salinity is 17 psu. At salinities between 10 and 30 psu, the filtration rates did not vary much, but at 5 psu the filtration rates were significantly lower. Next, we studied dwarfed M. edulis (<25 mm shell length) from Central Baltic Sea (Askö, Sweden) where the mean salinity is 6.5 psu. The maximum filtration rate (F, ml min−1 ind.−1) as a function of shell length (L, mm) and dry weight of soft parts (W, mg) were found to be: F = 0.003L 2.71 and F = 0.478W 0.92, respectively, and these results indicate that the filtration rates of dwarfed Baltic Sea mussels are comparable to filtration rates of Great Belt mussels of similar size exposed to salinities >10 psu. When Baltic Sea mussels acclimatized to 20 psu in the laboratory were exposed to 6.5 psu this caused a drastic reduction in the filtration rate, but after about 2 days the previous high filtration rate was regained at 6.5 psu, and further, a similar pattern was observed when the 6.5 psu exposed mussels were finally re-exposed to 20 psu. The observed lack of Great Belt mussels to completely adjust to 5 psu, in contrast to the ease of Baltic Sea mussels to adjust back and forth between 6.5 and 20 psu, is remarkable and may perhaps be explained by different genotypes of Great Belt and Baltic Sea mussels.
Introduction
The blue mussel, Mytilus edulis, is dwarfed in the inner Central Baltic Sea where the salinity is 6–8 psu (Kautsky 1982; Tedengren and Kautsky 1986; Vuorinen et al. 2002). In the Northern Baltic Sea along the southern coast of Finland, where the salinity decreases from 6.5 psu in the west to become only 3 psu in the east, M. edulis lives at the margin of its salinity tolerance and here there is a pronounced decrease in mussel size along the decreasing salinity gradient (Westerbom et al. 2002). Permanent low salinities, frequency and amplitude of salinity changes, as well as the changing rate of salinity may influence the filtration and growth rates, maximum shell length, and early development and survival of mussels (Theisen 1978; Davenport 1979a, b; Almada-Villela 1984; Gruffydd et al. 1984; Kautsky et al. 1990; Tedengren et al. 1990; Westerbom et al. 2002; Qiu et al. 2002), and recently, Hiebenthal et al. (2012) found that temperature may interact with these salinity effects. Acclimation to changing salinities can take place (Davenport 1979a, b; Sundaram and Shafee 1994; Gardner and Thompson 2001; Qiu et al. 2002; Marsden 2004; Suja and Muthiah 2006; Hamer et al. 2008), but due to acute salinity-induced valve closure and reduced filtration rate in the acclimation period, the resulting temporarily effects may blur the true ability of mussels to filter and grow at low salinities as recently shown by Riisgård et al. (2012b). Therefore, knowledge on potential ability and actual acclimation time for partly or fully acclimation to new salinities is of basic importance for our understanding of feeding and growth of mussels in estuarine systems.
The allozyme frequencies in M. edulis collected at locations in the transition zone between the Baltic Sea and the North Sea has been studied by Theisen (1978) who observed a very conspicuous cline for the 3 allozyme loci studied, and due to the about 4 weeks long pelagic stage of M. edulis larvae Theisen suggested that the differentiation was not caused by geographic isolation but by the salinity level being “the most evident selective agent”. Subsequent studies have confirmed that there are large genetic differences between Baltic and North Sea populations of M. edulis (e.g. Bulnheim and Gosling 1988; Johannesson et al. 1990). More recent studies on allozyme, nuclear DNA and mitochondrial DNA (mtDNA) markers have shown that the entire Baltic Sea is inhabited by a peculiar member of the M. edulis complex of blue mussels, that is, Mytilus trossulus which shows some genetic introgression from M. edulis and whose mtDNA has been almost completely replaced by M. edulis mtDNA (Riginos and Cunningham 2005; Zbawicka et al. 2007; Stuckas et al. 2009; Väinölä and Strelkov 2011). Studies on the effects of gene flow across the Baltic Mytilus hybrid zone, characterized by multilocus clines between M. edulis and M. trossulus, provide intriguing perspectives. Thus, a number of studies have attempted to assess the effects of the genotypic differences on growth, morphology and physiological performance of mussels from the two populations (Kautsky et al. 1990; Tedengren et al. 1990; QueryGilek et al. 2001). However, the effect of salinity on the filtration rate of mussels from the two populations has not yet been clarified (cf. Tedengren et al. 1990; Gilek et al. 1992).
In the present work, we studied the effect of constant ambient salinities between 5 and 30 psu on the filtration rate of M. edulis in long-term (weeks) laboratory acclimation experiments performed with mussels collected in the Great Belt (Denmark) where they were locally acclimated to 17 psu, and further, we measured the filtration rate and effects of salinity changes between 20 and 3.7 psu on dwarfed M. edulis collected in the Central Baltic Sea where they were locally adapted to 6.5 psu.
Materials and methods
Part I: mussels from Great Belt
Mussels of different size were collected from farm ropes in Kerteminde Bay (17.2 psu) 2 weeks before experimentation. Kerteminde Bay is part of the Great Belt, Denmark, where the salinity in the brackish water above the permanent halocline (Kullenberg and Jacobsen 1981; Jürgensen 1995; Møller 1996; Fyn County 2001; Bendtsen et al. 2009) has a mean (±SD) of 16.6 ± 0.6 psu and range of 10.3–24.4 psu for the period 2000–2010 (Riisgård et al. 2012b, Table 1 therein). Mussels were sorted into shell length size groups for every millimetre, and 240 individuals of 30–33 mm shell length were selected and divided into the 6 aquaria each with 40 mussels randomly selected from the 30 to 33 mm pool. Mussels were acclimated in the laboratory for 2 weeks to 5.3 ± 0.2, 10.4 ± 0.2, 15.4 ± 0.2, 20.0 ± 0.1, 25.0 ± 0.3 and 29.6 ± 0.1 psu in 16 l aquaria fully mixed by means of air stones before the filtration rate was subsequently measured during the next 21 days. Salinities were produced by either diluting natural Great Belt seawater with ion-exchanged water or adding sea-salt (Tetra Marine Salt). For the lowest salinity, mussels were initially exposed to 10 psu for 1 week before the salinity was further decreased to 5 psu. The bottom of the aquaria was cleaned every day, and all seawater in the aquaria was changed every 3 days. Mussels were exposed to a mean algal concentration of about 4,000 Rhodomonas salina cells ml−1 for 7 h per day (manually by repeated additions), and the filtration rate was measured two times daily by means of the clearance method. On day 0, 7, 14 and 21, 10 mussels were removed for determination of shell length, dry weight of soft parts (90 °C, 24 h) and condition index.
In a supplementary experiment, the acute effect of low salinity was studied. Here, the mean individual filtration rate in two groups of mussels (Group I: L = 29.8 ± 0.4 mm; Group II: L = 29.6 ± 0.4 mm; n = 20) was first measured at in fully mixed aquaria with 25 psu Great Belt seawater added sea salt (Tetra Marine Sea Salt). Subsequently, the mussels were exposed to low-saline seawater (about 7 psu) for 2 days, while being fed about 4,000 R. salina cells ml−1 before the filtration rate was measured.
Part II: mussels from Central Baltic Sea (Askö)
Mussels of different sizes were collected by means of scraping the bottom in the central Baltic Sea in the shallow waters around the island of Askö, about 70 km south of Stockholm, Sweden, where the salinity is low and stable, ranging from 6 to 7 psu (Gilek et al. 2001), and in this area, M. edulis is dwarfed (Kautsky 1982; Tedengren and Kautsky 1986; Vuorinen et al. 2002). The mussels were transported in a cooling box without water to the Marine Biological Research Centre, Kerteminde, where all experiments were performed. The mussels were kept in seawater collected at the collecting site (6.5 psu, 9 °C) and later in artificial seawater with 6.5 psu produced from ion-exchanged water added sea-salt (Tetra Marine Sea Salt). Mussels were fed once a day with R. salina.
First (Part IIa), the filtration rates of 6 size classes of mussels (#1 to #6, n = 19–29) were measured in 16 l aquaria in parallel using the clearance method, and air stones ensured full mixing of the water. Afterwards, the gill area and dry weight of soft parts were determined. The gill area of mussels was measured according to Riisgård et al. (2011). The mussel was opened, and the two shells separated with a scalpel in such a way that the gill area remained intact. The two shells with the gills were placed together with a ruler under a stereomicroscope, and a photograph was taken. From an enlarged printout of the photograph the area of a single gill layer was cut out, weighted, and the weight compared to a reference paper with a known area and weight. For calculating the total gill area, the area of the single gill layer was multiplied with a factor 8 (2 W-shaped gills, each with 2 demibranchs and 2 lamellae of same size).
Next (Part IIb) in order to study the effect of acute salinity changes on the filtration rate, 2 groups of each 5 mussels (mean ± SD shell length = 14.7 ± 0.3 mm) were initially acclimatized to 20 psu at approximately 13 °C for 7 days and then subsequently exposed to 6.5 psu for about 6 days before the salinity was changed back to 20 psu again.
Finally (Part IIc), to investigate the filtration behaviour of 6.5 psu adapted mussels at even lower salinity, 5 mussels (mean ± SD shell length = 14.6 ± 0.4 mm) from Askö were exposed to a reduced salinity of 3.7 ± 0.2 psu and temperature of 8.7 ± 0.3 °C in an aquarium to study the filtration rate in mussels exposed to salinity lower than their naturally occurring salinity of 6.5 psu by using the clearance rate method. The mussels were first acclimated for 2 weeks to 6.5 psu and subsequently for 2 days to the 3.7 psu salinity before clearance rates were measured. Prior to every filtration rate measurement algae were added to the 4 l feeding aquarium to maintain an algae cell concentration of 3,000–5,000 cells ml−1.
Filtration rate was measured by means of the clearance method (e.g. Coughlan 1969; Jørgensen 1990) using an aquarium with mussels and well-mixed seawater added algal cells that are 100 % efficiently retained by the gills of the mussels (i.e. diameter >4 μm). The filtration rate (F) was determined from the exponential decrease in algal concentration as a function of time using the formula: F = V × b/n, where V = volume of seawater, b = slope of regression line in a semi-ln plot for the reduction in algal concentration with time in the aquarium, n = number of mussels. The algal concentration was measured by means of an electronic particle counter (Elzone 5380) or in some cases by a fluorometer (Aquafluor, Turner Designs).
Weight-specific growth rate of mussels can be estimated according to the equation (Riisgård et al. 2012a, Eq. 22 therein): μ = ln(W t /W 0)/Δt, where W t and W 0 are the corresponding dry weights of bivalve soft tissue at end and start, and Δt the growth period. In the present work, the slope of regression line for ln W versus t was used as an estimate of the mean μ during the experimental period.
Condition index (CI, mg cm−3) was calculated from the dry weight of soft parts (W, mg) and the shell length (L, cm): CI = W/L 3.
The flagellate R. salina (about 6 μm in diameter) was grown in repeated batch cultures in 20-l bottles containing 15 l of seawater (20 psu) enriched with f/2-medium. Cultures were continuously illuminated by fluorescent light tubes. Aeration and mixing were ensured by injection of compressed air. Every day 5 l of algal suspension was withdrawn and replaced by fresh medium.
Statistical analysis of impact of salinity on filtration rate was carried out by one-way repeated measures analysis of variance (ANOVA) in SigmaPlot 12.
Results
Part I: mussels from Great Belt
The filtration rate of M. edulis, locally acclimated to the salinity in Great Belt and acclimated in the laboratory for 2 weeks to 5, 10, 15, 20, 25 and 30 psu prior to subsequent 7-h daily measurements during the following 21 days, are shown in Fig. 1 and Table 1. It appears that the filtration rates between 10 and 30 psu are nearly identical with a tendency towards slightly higher values during the experimental period, but the filtration rate at 5 psu remains lower. The increase in shell length and weight-specific growth rate during the experimental period is modest, but with a trend of slightly higher rates at salinities >10 psu.

Mytilus edulis (Great Belt, Table 1). Mean individual filtration rate (F) measured during 21 days, here split up into 3 periods: day 0–7, day 8–14 and day 15–21, with mussels exposed to 5, 10, 15, 20, 25 and 30 psu, respectively. ±SD indicated
In order to further evaluate the effect of low salinity on the filtration rate, two groups of mussels acclimated to about 25 psu were acutely exposed to 7 psu and the filtration rate measured (Table 3). As it appears from Table 3, the mean individual filtration rate measured at 7 psu was in both groups lower than the reference (control) filtration rate measured at 25 psu. ANOVA revealed that the filtration rates measured at 5 and 7 psu (Tables 1, 2) are significantly (P < 0.001) lower than filtration rates measured at 10–30 psu (Table 1).
Part II: mussels from Central Baltic Sea (Askö)
-
a.
The measured filtration rate and gill area as a function of mussel size are shown in Fig. 2 and Table 3. The maximum shell length of the dwarfed Baltic mussels was about 24 mm, and the power functions of filtration rate (F, ml min−1 ind.−1) as a function of shell length (L, mm) and dry weight of soft parts (W, mg) were found to be: F = 0.003L 2.71 and F = 0.478W 0.92, respectively, whereas the gill area (G, cm2) could be expressed as G = 0.006L 2.19. Finally, the F/G-ratio which expresses the approach velocity of water in the direction normal to the gill surface is about 0.3 mm s−1 in all size classes.
Fig. 2 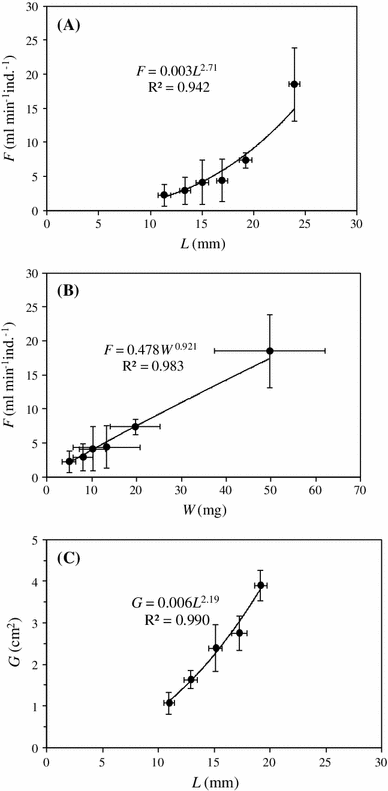
Mytilus edulis (Askö, #1 to #6, Table 3). a Mean individual filtration rate (F) at 6.5 psu as a function of mean shell length (L). b Mean filtration rate as a function of mean body dry weight (W). c Gill area (G) as a function of shell length. ±SD indicated
Table 3 Mytilus edulis (Askö) -
b.
Figure 3 shows the effect of salinity changes on the filtration rate of Askö mussels initially acclimatized to 20 psu in the laboratory (Table 4, #7 and #8) and subsequently exposed to 6.5 psu before again exposed to 20 psu. It is seen that the initially acute exposure of 20 psu acclimated mussels to 6.5 psu caused a drastic reduction in filtration (valve closure), but after about 2 days, the high filtration rate was regained at 6.5 psu, and further, a similar pattern was observed when the 6.5 psu exposed mussels were finally re-exposed to 20 psu.
Fig. 3 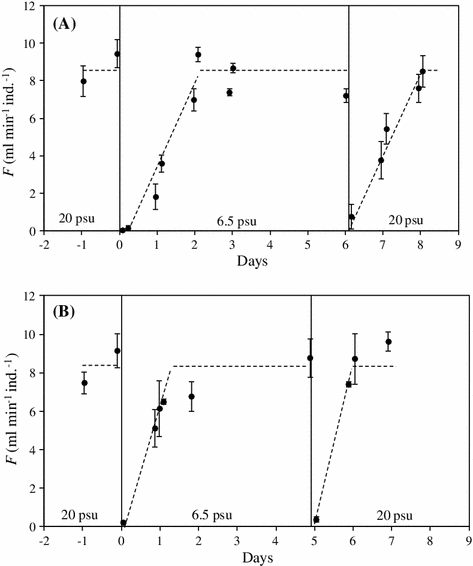
Mytilus edulis (Askö). a Mean individual filtration rates (F, ml min−1) of mussels (#7, Table 4) locally adapted to 6.5 psu at Askö and initially acclimatized to 20 psu for 7 days in the laboratory and then acutely re-exposed to 6.5 psu on day 0 (vertical line) before they again were exposed to 20 psu. b Repetition of the above experiment, but with a new group of mussels (#8, Table 4). The punctured lines fitted by eye indicate the behaviour of F during the experiments. ±SD indicated
Table 4 Mytilus edulis (Askö) -
c.
The filtration rate of 6.5 psu adapted Askö mussels exposed to a reduced salinity of 3.7 psu during 6 days before measurement was found to be 4.9 ± 1.3 ml min−1 for a 14.5 ± 0.5 mm mussel (Table 4).


Discussion
It is a new and interesting observation that Great Belt mussels were not able to adjust their filtration rate at 5 psu during the 3-week experimental period (Fig. 1), whereas Askö mussels were able to completely adjust their filtration rate within one to 2 days when they were first exposed to 20 psu and subsequently re-exposed to 6.5 psu (Fig. 3).
The present study is the first to lay down the filtration rate and gill area as a function of size of dwarfed Baltic mussels with maximum shell length of about 24 mm (Fig. 2). The power functions of filtration rate (F, ml min−1 ind.−1) as a function of shell length (L, mm) and dry weight of soft parts (W, mg) were found to be: F = 0.003L 2.71 and F = 0.478W 0.921, respectively, whereas the gill area (G, cm2) was found to be G = 0.006L 2.19. These equations may be compared to those recently presented by Riisgård et al. (2011, Figs. 7, 8 and 9 therein). For comparison a 20 mm shell length mussel, which has overlap with the lower size range of mussels studied by Riisgård et al. (2011), may be considered here. The estimated values using the present equations are F = 9.3 ml min−1 (8 °C) and G = 4.2 cm2 which are in quite good agreement with the estimated values F = 14.6 ml min−1 (12 °C) and G = 4.7 cm2 using the allometric equations reported by Riisgård et al. (2011). Finally, the F/G-ratio which expresses the approach velocity of water in the direction normal to the gill surface was in the present study found to be 0.31 ± 0.03 mm s−1 (mean ± SD of all size classes, Table 3) which may be compared to F/G = [(14.7/60) × 10/4.7 =] 0.52 mm s−1 estimated on basis of Riisgård et al. (2011) and 0.85 mm s−1 reported by Riisgård and Larsen (2000) using literature values, and about 1 mm s−1 (19 °C) measured by themselves using video recordings through the inhalant opening on an intact 15 mm shell length M. edulis. However, temperature differences may partly explain the different F/G-ratio. Using the relationship between filtration rate and temperature found for M. edulis by Kittner and Riisgård (2005), the F value for Askö mussels at 19 °C would for example be 36 % higher = (9.3 × 1.36 =) 12.6 ml min−1 and thus F/G = 0.5 mm s−1 in fairly good agreement with values obtained on mussels from areas with higher salinities. Therefore, it seems reasonably to conclude that the filtration rate, gill area and F/R-ratio of dwarfed Baltic Sea mussels are comparable to mussels from the Great Belt and other marine areas with substantially higher salinities, and this statement also seems to settle some of the open questions about possible differences between Baltic and North Sea M. edulis earlier pointed out by, for example, Tedengren et al. (1990).
Kautsky et al. (1990) found that the growth rate of M. edulis is much lower in the Baltic Sea (7 psu) than in the North Sea (28 psu), and reciprocally, transplanted mussels were found to grow at rates similar to those of native mussels, “indicating that this variation can largely be explained by physiological differences due to environmental salinity” rather than “regulated by non-genetic factors”. Further, the survival of Baltic Sea mussels was very high in contrast to mortality over 90 % among North Sea mussels transferred to the Baltic Sea, and therefore, Kautsky et al. (1990) suggested that the different survival “probably have mainly genetic causes”. Subsequently, Gilek et al. (2001) compared the filtration rates of M. edulis from the two populations and found that the weight-specific filtration rate was 7 ± 4 l g−1 h−1 for Baltic Sea (Askö) and for North Sea (Tjärnö) mussels somewhat lower filtration rates of 4 ± 1 l g−1 h−1 (Yttre Vattenholmen) and 3.8 ± 0.7 l g−1 h−1 (Strömstad) were found. However, considerably lower specific filtration rates were reported by Tedengren et al. (1990) for both native North Sea mussels and transplanted Baltic Sea mussels acclimated to North Sea conditions, and it was found that the two groups of mussels in 1987 had near identical filtration rates of 2.42 and 2.10 l g−1 h−1, respectively, but not in 1988 when the North Sea mussels were found to have higher filtration rates (2.34 l g−1 h−1) than the transplanted Baltic Sea mussels (0.84 l g−1 h−1). A direct comparison of the above filtration rates with the filtration rates reported in the present study is not possible, because the filtration rates reported by both Gilek et al. (2001) and Tedengren et al. (1990) were converted to mass-specific rates for 1 g body dry weight mussels by using a weight exponent b = 0.4 in the allometric equation: F = aW b. However, an Askö mussel with 50 mg body dry weight was in the present study found to have a filtration rate of about 17.5 ml min−1 (Fig. 2b), and using b value of 0.4, the weight-specific filtration rate is found to be F/W 0.4 = (17.5 × 60 × 0.001/0.050.4 = 1.1/0.3 =) 3.5 l g−1 h−1. But using a more appropriate b value of 0.66 (Riisgård 2001, Table 1 therein), the calculated specific filtration rate becomes (1.1/0.050.66 =) 7.95 l g−1 h−1 which is close to 7.45 l g−1 h−1 reported by Møhlenberg and Riisgård (1979).
Recently, Riisgård et al. (2012b) studied the effect of different salinities (between 10 and 30 psu) on M. edulis from the Great Belt in laboratory feeding and growth experiments. They measured a tendency towards reduced growth with decreasing salinity, reflected as reduced shell growth rate and decreasing weight-specific growth rate with falling salinity, and the authors concluded that the observed effect of salinity could partly be explained by a temporary shell valve closure after an acute change in salinity. This seems to indicate that mussels that are well acclimated to different constant salinities between 10 and 30 psu may actually grow at comparable rates under otherwise identical conditions. The present study supports this hypothesis, because long-term salinity acclimated Great Belt mussels between 10 and 30 psu have near identical filtration rates (Fig. 1). But at 5 psu, the mean filtration rate from the Great Belt remains significantly reduced (Fig. 1), in striking contrast to the fast acclimation rate of mussels from the Baltic Sea (Fig. 3).
Apart from possible differences in phytoplankton biomass, the much lower growth rate of mussels in the Baltic Sea has been suggested to be due to salinity-dependent change in amino acid metabolism and nitrogen excretion causing a less favourable energy balance in low-saline areas (Tedengren and Kautsky 1986; Tedengren et al. 1990). Finally, it should be mentioned that there are large differences in allozyme frequencies between Baltic and North Sea mussels (Theisen 1978) and observed high initial mortality of North Sea mussels transplanted to the Baltic Sea has been found to be selective in certain enzyme loci so that only North Sea mussels of Baltic Sea genotype survived (Johannesson et al. 1990). The observed lack of Great Belt mussels to completely adjust to 5 psu (Fig. 1) in contrast to the ease of Baltic Sea mussels to adjust back and forth between 6.5 and 20 psu (Fig. 3) may thus be explained by different genotypes of the experimental mussels collected at two sites within the Baltic Mytilus hybrid zone (Bulnheim and Gosling 1988; Johannesson et al. 1990; Riginos and Cunningham 2005; Zbawicka et al. 2007; Stuckas et al. 2009; Väinölä and Strelkov 2011). Likewise, this may explain why the filtration rate of 14.5 mm Askö mussels exposed to an extremely reduced salinity of 3.7 psu was able to filter with a rate of 4.9 ± 1.3 ml min−1 (Table 3) which is comparable with F = 3.9 ml min−1 predicted from the equation shown in Fig. 2a, and F = 6.1 ml min−1 using the equation: F(ml min−1) = 0.02L(mm)2.14 given by Kiørboe and Møhlenberg (1981; equation corrected according to Kiørboe pers. comm.) for M. edulis exposed to 30 psu and 9–17 °C.
References
Almada-Villela PC (1984) The effects of reduced salinity on the shell growth of small Mytilus edulis. J Mar Biol Assoc UK 64:71–182
Bendtsen J, Gustafsson KE, Söderkvist J, Hansen JLS (2009) Ventilation of bottom water in the North Sea-Baltic Sea transition zone. J Mar Syst 75:138–149
Bulnheim H-P, Gosling E (1988) Population genetic structure of mussels from the Baltic Sea. Helgoländer Meeresunters 42:113–129
Coughlan J (1969) The estimation of filtering rate from the clearance of suspension. Mar Biol 2:356–358
Davenport J (1979a) The isolation response of mussels (Mytilus edulis L.) exposed to falling seawater concentrations. J Mar Biol Assoc UK 59:123–132
Davenport J (1979b) Is Mytilus edilis a short term osmoregulator? Comp Biochem Physiol 64A:91–95
Fyn County (2001) Aquatic environment of Fyn, Denmark, 1976–2000. Streams and lakes, coastal waters, groundwater, environmental impact of wastewater and agriculture. Fyn County, Odense, p 148
Gardner JPA, Thompson RJ (2001) The effects of coastal and estuarine conditions on the physiology and survivorship of the mussels Mytilus edulis, M. trossulus and their hybrids. J Exp Mar Biol Ecol 265:119–140
Gilek M, Tedengren M, Kautsky N (1992) Physiological performance and general histology of the blue mussel, Mytilus edulis L., from the Baltic and North seas. Neth J Sea Res 30:11–21
Gilek M, Littorin B, Saetre P (2001) Spatial patterns of abundance and growth of Mytilus edulis on boulders in the Northern Baltic Sea proper. Hydrobiologia 452:59–68
Gruffydd LLD, Huxley R, Crisp DJ (1984) The reduction in growth of Mytilus edulis in fluctuating salinity regimes measured using laser diffraction patterns and the exaggeration of this effect by using tap water as the diluting medium. J Mar Biol Assoc UK 64:401–409
Hamer B, Jaksic Z, Pavicic-Hamer D, Peric L, Medakovic D, Ivankovic D, Pavicic J, Zilberg C, Schröder HC, Müller WEG, Smodlaka N, Batel R (2008) Effect of hypoosmotic stress by low salinity acclimation of Mediterranean mussels Mytilus galloprovincialis on biological parameters used for pollution assessment. Aquat Toxicol 89:137–151
Hiebenthal C, Philipp EER, Eisenhauer A, Wahl M (2012) Interactive effects of temperature and salinity on shell formation and general condition in Baltic Sea Mytilus edulis and Arctica islandica. Aquat Biol 14:289–298
Johannesson K, Kautsky N, Tedengren M (1990) Genotypic and phenotypic differences between Baltic and North Sea populations of Mytilus edulis evaluated through reciprocal transplantations. II. Genetic variation. Mar Ecol Prog Ser 59:211–219
Jørgensen CB (1990) Bivalve filter feeding: hydrodynamics, bioenergetics, physiology and ecology. Olsen & Olsen, Fredensborg, p 140
Jürgensen C (1995) Modelling of nutrient release from sediment in a tidal inlet, Kertinge Nor, Funen, Denmark. Ophelia 42:163–178
Kautsky N (1982) Growth and size structure in a Baltic Mytilus edulis population. Mar Biol 68:117–133
Kautsky N, Johannesson K, Tedengren M (1990) Genotypic and phenotypic differences between Baltic and North Sea populations of Mytilus edulis evaluated through reciprocal transplantations. I. Growth and morphology. Mar Ecol Prog Ser 59:203–210
Kiørboe T, Møhlenberg F (1981) Particle selection in suspension-feeding bivalves. Mar Ecol Prog Ser 5:291–296
Kittner C, Riisgård HU (2005) Effect of temperature on filtration rate in the mussel Mytilus edulis: no evidence for temperature compensation. Mar Ecol Prog Ser 305:147–152
Kullenberg G, Jacobsen TS (1981) The Baltic Sea: an outline of its physical oceanography. Mar Pollut Bull 12:183–186
Marsden ID (2004) Effects of reduced salinity and seston availability on growth of the New Zealand little-neck clam Austrovenus stutchburi. Mar Ecol Prog Ser 266:157–171
Møhlenberg F, Riisgård HU (1979) Filtration rate, using a new indirect technique, in thirteen species of suspensions-feeding bivalves. Mar Biol 54:143–148
Møller JS (1996) Water masses, stratification and circulation. In: Jørgensen BB, Richardson K (eds) Eutrophication in coastal marine ecosystems. Amercian Geophysical Union. Coast Estuar Stud 52:51–66
Qiu J-W, Tremblay R, Bourget E (2002) Ontogenetic changes in hyposaline tolerance in the mussels Mytilus edulis and M. trossulus: implications for distribution. Mar Ecol Prog Ser 228:143–152
Riginos C, Cunningham CW (2005) Local adaptation and species segregation in two mussel (Mytilus edulis × Mytilus trossulus) hybrid zones. Mol Ecol 14:381–400
Riisgård HU (2001) On measurement of filtration rate in bivalves—the stony road to reliable data, review and interpretation. Mar Ecol Prog Ser 211:275–291
Riisgård HU, Larsen PS (2000) A comment on experimental techniques for studying particle capture in filter-feeding bivalves. Limnol Oceanogr 45:1192–1195
Riisgård HU, Jørgensen BH, Lundgreen K, Storti F, Walther JH, Meyer KE, Larsen PS (2011) The exhalant jet of mussels Mytilus edulis. Mar Biol Prog Ser 437:147–164
Riisgård HU, Lundgreen K, Larsen PS (2012a) Field data and growth model for mussels Mytilus edulis in Danish waters. Mar Biol Res 8:683–700
Riisgård HU, Bøttiger L, Pleissner D (2012b) Effect of salinity on growth of mussels, Mytilus edulis, with special reference to Great Belt (Denmark). Open J Mar Sci 2:167–176
Stuckas H, Stoof K, Quesada H, Tiedemann R (2009) Evolutionary implications of discordant clines across the Baltic Mytilus hybrid zone (Mytilus edulis and Mytilus trossulus). Heredity 103:146–156
Suja N, Muthiah P (2006) Effect of salinity on the growth and survival of spat of Marcia opima (Gmelin). J Mar Biol Assoc India 48:253–255
Sundaram KS, Shafee MS (1994) Salinity tolerance of some bivalves of Ennore estuary. J Mar Biol Assoc India 31:299–302
Tedengren M, Kautsky N (1986) Comparative study of the physiology and its probable effect on size in blue mussels (Mytilus edulis L.) from the North Sea and the northern Baltic proper. Ophelia 25:147–155
Tedengren M, André C, Johannesson K, Kautsky N (1990) Genotypic and phenotypic differences between Baltic and North Sea populations of Mytilus edulis evaluated through reciprocal transplantations. III. Physiology. Mar Ecol Prog Ser 59:221–227
Theisen BF (1978) Allozyme clines and evidence of strong selection in three loci in Mytilus edulis L. (Bivalva) from Danish waters. Ophelia 17:135–142
Väinölä R, Strelkov P (2011) Mytilus trossulus in Northern Europe. Mar Biol 158:817–833
Vuorinen I, Antsulevich AE, Maximovich NV (2002) Spatial distribution and growth of the common mussel Mytilus edulis L. in the archipelago of SW-Finland, Northern Baltic Sea. Boreal Environ Res 7:41–52
Westerbom M, Kilpi M, Mustonen O (2002) Blue mussels, Mytilus edulis, at the edge of the range: population structure, growth and biomass along a salinity gradient in the north-eastern Baltic Sea. Mar Biol 140:991–999
Zbawicka M, Burzynski A, Wenne R (2007) Complete sequences of mitochondrial genomes from the Baltic mussel Mytilus trossulus. Gene 406:191–198
Acknowledgments
This work formed part of the MarBioShell project supported by the Danish Agency for Science, Technology and Innovation for the period January 2008 to December 2012. Thanks are due to Eva Lindell at the Askö Laboratory, University of Stockholm, for assistance with collecting of mussels. Thanks are due to the Danish Nature Agency, Danish Ministry of the Environment, for providing hydrographical data, and to two anonymous referees for constructive comments on the manuscript.
Author information
Authors and Affiliations
Corresponding author
Additional information
Communicated by H.-D. Franke.
Rights and permissions
About this article
Cite this article
Riisgård, H.U., Lüskow, F., Pleissner, D. et al. Effect of salinity on filtration rates of mussels Mytilus edulis with special emphasis on dwarfed mussels from the low-saline Central Baltic Sea. Helgol Mar Res 67, 591–598 (2013). https://doi.org/10.1007/s10152-013-0347-2
Received:
Revised:
Accepted:
Published:
Issue Date:
DOI: https://doi.org/10.1007/s10152-013-0347-2